From Drawing to Report — The Hardest Part of Landscape Irrigation Projects 🌱
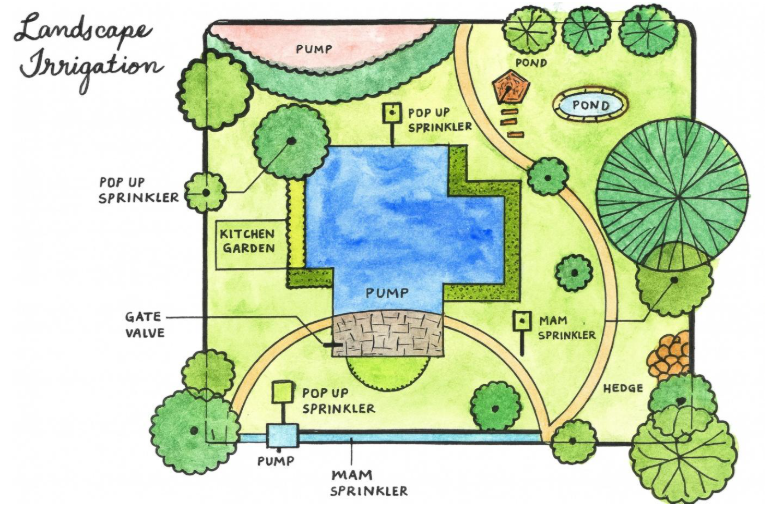
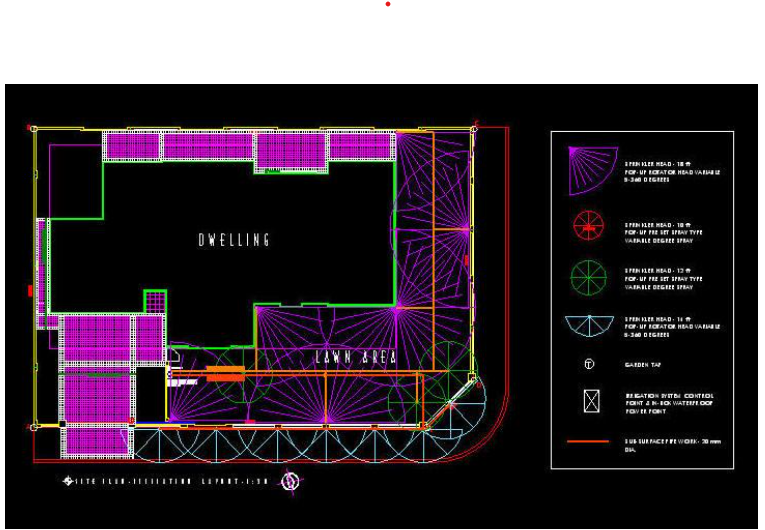
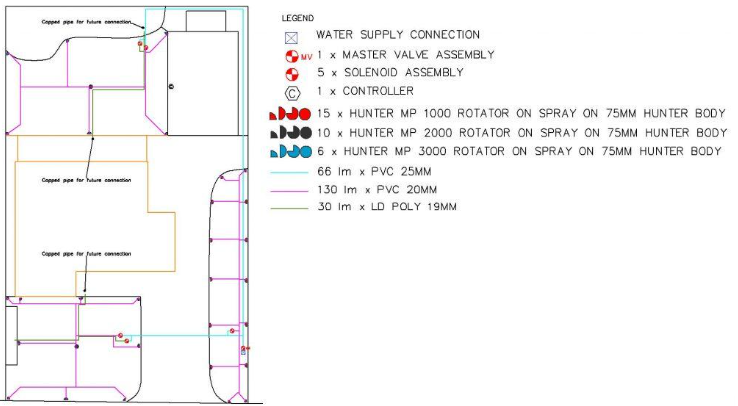

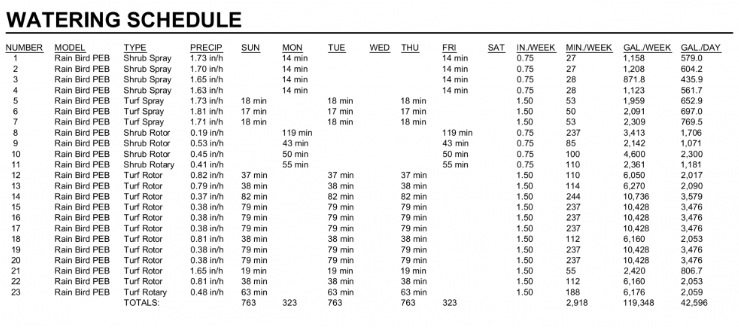
Preparing drawings for a landscape irrigation project is already complex — but preparing accurate reports from those drawings is often the most frustrating part.
Counting trees block by block, identifying their sizes, measuring zone-wise areas, separating shrubs from green cover, and finally converting all that into a usable report…
Most teams still do this manually, spending hours (or days) on something that should take minutes — with errors always lurking.
What Is a Landscape Irrigation Project?
Landscape irrigation is not just about watering plants.
It is about engineering water efficiency in a world where groundwater is depleting rapidly and irrigation water availability is limited.
- Optimal water usage
- Proper zoning based on plant type
- Balanced pressure and flow
- Sustainable green cover planning
This requires precise planning, accurate drawings, and reliable quantity reports.
How Landscape Irrigation Drawings Are Typically Prepared
In a standard landscape irrigation CAD workflow:
- Trees are represented as blocks
- Shrubs and green cover are represented using symbols or hatch patterns
- Irrigation zones are drawn as polygons
The drawing becomes data-rich — but that data remains locked inside the CAD file.
Why Report Preparation Becomes a Major Challenge
- Manual block counting
- Layer-based assumptions
- Area calculations per polygon
- Copying data into Excel
This process is extremely time-consuming, error-prone, difficult to update, and stressful during revisions.
Our AutoLISP-Based Solution: Reports Directly From the Drawing
We have developed a custom AutoLISP program that analyzes the drawing programmatically and converts geometry into meaningful reports — instantly.
What You Get — Instantly
- Zone-wise area details
- Count of trees by size category
- Categorization of trees, shrubs, and green cover
- Ready-to-use CSV output
From CAD Geometry to Smart Irrigation Intelligence
Landscape irrigation drawings already contain all the data you need.
Our solution simply unlocks that data and converts it into actionable reports — in minutes instead of days.
👉 Want to see how it works in real projects? Watch the demo video and experience the workflow in action.